PyQt5的文档相对较少,在自己的实际开发使用中,遇到了些许的坑。网上也没有大把的例子供我参考,还有好多例子停留在Qt4这个版本。所以将调bug的过程记录于此,均为自己探索的较为良好的解决方案。包括:
布局相关
代码结构
qtpandas的版本问题
切换主题
数据库使用
pyqtgraph绘图
提升窗口(matplotlib)
Html的动态绘图
同样,代码太长,不能全部放上来,只放了核心代码,稍微有GUI开发基础的人都能看懂。或者,你可以按照目录观看自己想要的部分。或者,去给出的github链接内拿代码。
代码链接 https://github.com/muyuuuu/PyQt-learn/tree/master/GUI/Basic-train
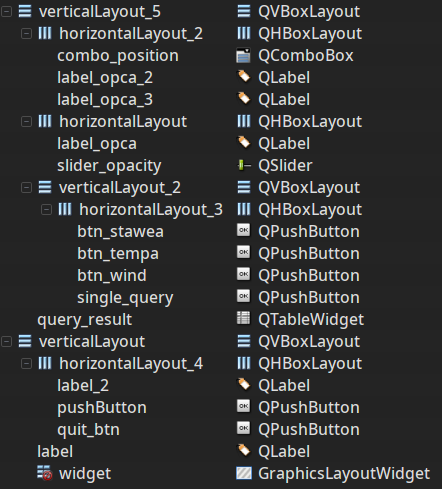
布局相关 还是使用Qt designer进行布局管理较为方便,写代码一行一行的调试实在是费劲。而且,可以在布局管理器中进行嵌套布局,如先对几个小控件进行水平布局,在对另外的空间垂直布局,最后整体网格布局,这样会较为便捷。效果如下所示:
verticalLayout_5 下面有多个布局。此外,Qt designer里面设置的布局不一定为软件最终的布局,还是要实际运行一下,看看到底软件长啥样。如,在designer里面每个控件都很大,实际运行却可能很小,不过大体相同。
代码结构 QWidget 是所有类的基类,也包括QMainWindow,而在设置窗口风格时,只能在QWidget里面使用self.setStyleSheet(self.style), 在QMainWindow里面则无效(这里的无效是指:切换主题后会有一些设置无法更改,导致界面很丑)。
但是,一个完整的窗口程序(包括任务栏,菜单栏,状态栏等)是离不开QMainWindow的,所以我们可以在QMainWindow设置中心区域为QWidget,然后在QWidget里面添加控件即可,即将控件的实现和布局委托给QWidget。
所以,我们需要两个ui文件。与控件相关的东西,如添加控件,修改控件可以在QWidget里面完成,而有关窗口的设置,如菜单栏,设置透明度,居中显示等可以在QMainWindow里面设置,最后将QWidget添加即可。
1
2
3
4
5
6
7
8
9
10
11
12
13
14
15
16
17
18
19
20
21
22
23
24
25
26
27
28
29
30
31
32
33
34
35
36
37
38
39
40
41
42
43
44
45
46
47
48
49
50
51
52
53
54
55
56
57
58
59
60
61
62
63
64
65
66
67
from mainwidget import Ui_Form from mainwindow import Ui_MainWindow class MyMainWidget (QWidget, Ui_Form): def __init__ (self, parent = None ): super (MyMainWidget, self).__init__(parent) self.setupUi(self) self.setLayout(self.gridLayout) self.quit_btn.clicked.connect(self.quit_act) def quit_act (self ): sender = self.sender() print (sender.text() + '键被按下' ) qApp = QApplication.instance() qApp.quit() class MyMainWindow (QMainWindow, Ui_MainWindow): def __init__ (self, parent = None ): super (MyMainWindow, self).__init__(parent) self.setupUi(self) q = MyMainWidget() self.setCentralWidget(q) self.setWindowOpacity(0.9 ) self.status = self.statusBar() self.status.showMessage("你在主页面~" ) self.setWindowTitle("建模协会录入信息" ) self.center() def center (self ): ''' 获取桌面长宽 获取窗口长宽 移动 ''' screen = QDesktopWidget().screenGeometry() size = self.geometry() self.move((screen.width() - size.width()) / 2 , (screen.height() - size.height()) / 2 ) if __name__ == "__main__" : app = QApplication(sys.argv) mywin = MyMainWindow() mywin.show() sys.exit(app.exec ())
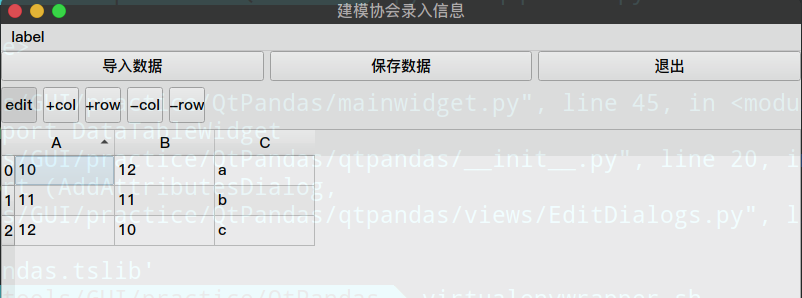
qtpandas的使用 pandas是比较好好用的数据分析的库,而与PyQt5的结合,最方便的方法是使用qtpandas。这个库会将pandas的数据显示在QTableWidget上,自动实现QTableWidget的各种功能,如增加,排序,保存,删除等。
但是,pip install qtpandas暂时的版本只支持PyQt4,如果想支持PyQt5,需要去github下载最新版。下载好后进入目录,命令行内python setup.py install即可。
而且qtpandas依赖于pandas 0.23,需要提前安装pandas 0.23。如果直接pip install pandas是不可以的,因为直接pip会到最新版0.25(写这篇博客的时候),qtpandas不能使用,会直接报错:
1 No module named 'pandas.tslib
因此我创建了虚拟环境,在虚拟环境内直接pip install pandas==0.23 即可,但是还不能放心使用。
通过这几天的使用发现,PyQt5的依赖库做的都不是很好。
有些库pip后可以放心使用;pip后关机开机电脑才能生效,比如pyqtgraph;pip后关机开机还是用不了,比如qtpandas。
于是,我在github上下载了qtpandas,将文件夹放在代码的同级目录下,便可以引用进来,然后使用。期待开发者做后后面的完善吧。
https://github.com/draperjames/qtpandas
库的安装很费劲,但是,真的好用,代码与截图如下:
文件结构:(qtpandas的文件夹在这,调用里面的代码,库的本质还是代码啊)
执行效果:
代码如下:1 2 3 4 5 6 7 8 9 10 11 12 13 14 15 16 17 18 19 20 21 22 23 24 25 26 27 28 29 30 31 32 33 34 35 36 37 38 39 40 from qtpandas.views.DataTableView import DataTableWidgetfrom qtpandas.models.DataFrameModel import DataFrameModelclass MyMainWidget (QWidget, Ui_Form): def __init__ (self, parent = None ): super (MyMainWidget, self).__init__(parent) self.setupUi(self) self.setLayout(self.gridLayout) self.quit_btn.clicked.connect(self.quit_act) model = DataFrameModel() self.widget_2.setViewModel(model) data = { 'A' : [10 , 11 , 12 ], 'B' : [12 , 11 , 10 ], 'C' : ['a' , 'b' , 'c' ] } self.df = pandas.DataFrame(data) self.df['A' ] = self.df['A' ].astype(np.int8) model.setDataFrame(self.df) self.quit_btn_7.clicked.connect(self.save_data) def save_data (self ): self.df.to_csv('data.csv' ) def quit_act (self ): sender = self.sender() print (sender.text() + '键被按下' ) qApp = QApplication.instance() qApp.quit()
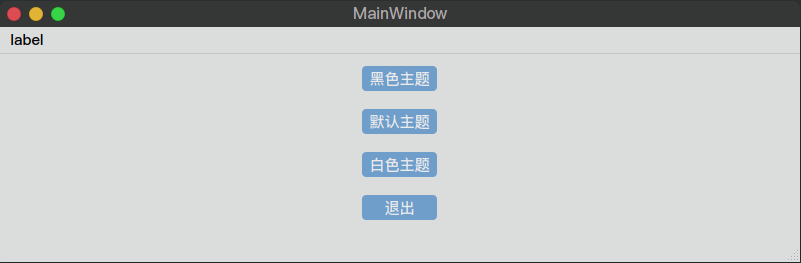
切换主题 对于我这种不会(不想写)前端的人来说,写QSS(Qt Style Sheet)无疑在要我命,不如用他人写好的代替一下,在代码中引入样式即可。这样也能实现界面和逻辑的代码分离。
别人写好的:https://blog.csdn.net/liang19890820/article/details/52384042
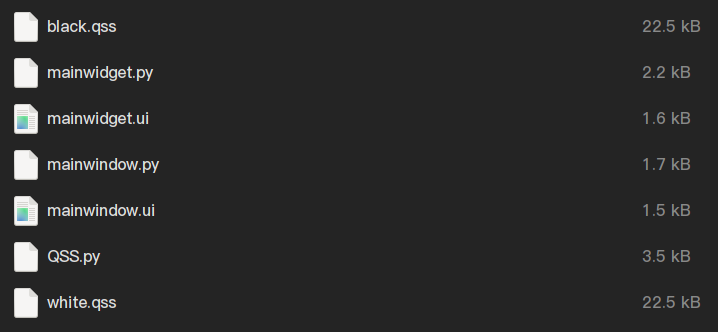
每个Widget都可以设置风格,因此建议主要界面使用QWidget作为窗口的主要区域用于设背景风格。同样,如上文提到的,QMainWindow里切换风格效果很不好,不如把所有控件放在QWidget里面,切换风格也方便。black.qss还有white.qss都是从上面的CSDN里的博客下载的。
文件结构如下:
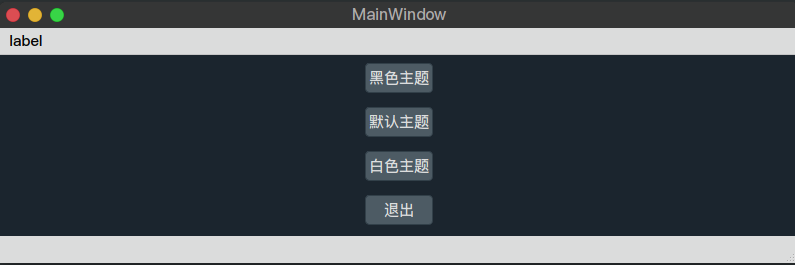
切换风格的代码如下:1 2 3 4 5 6 7 8 9 10 11 12 13 14 15 16 17 18 19 20 21 22 23 24 25 26 27 class StyleFile : def __init__ (self ): pass def readQSS (style ): with open (style, 'r' ) as f: return f.read() class MyMainWidget (QWidget, Ui_Form): def __init__ (self, parent = None ): super (MyMainWidget, self).__init__(parent) self.setupUi(self) self.quit_btn_3.clicked.connect(self.style_change) self.quit_btn_4.clicked.connect(self.style_change1) def style_change1 (self ): style_file = 'white.qss' self.style = StyleFile.readQSS(style_file) self.setStyleSheet(self.style) def style_change (self ): style_file = 'black.qss' self.style = StyleFile.readQSS(style_file) self.setStyleSheet(self.style)
效果如下:
黑色主题
而设置窗口的无边框风格、透明度风格则必须要在QMainWindow里面设置,因为这是窗口的特有方法。
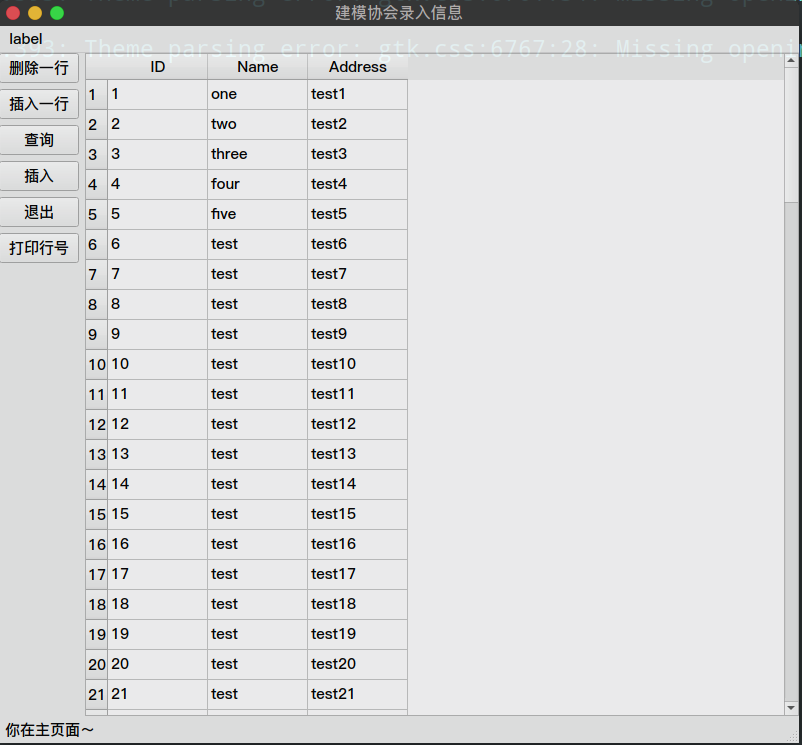
数据库的使用 数据库的使用还是很常见的,对于开发小型的应用程序,使用SQLite即可(Manjaro环境下已经内置),以及可视化的管理软件SQLiteStudio。PyQt使用QSqlDataBase连接数据库,一个实例表示了一次连接(连接到IP地址,本地数据库均可),连接、操作完毕后记得关闭,否则会占用数据库的资源。
此外,QSqlTableModel提供了可读写的数据模型,链接到数据库后可设置查询的表。设置查询的过滤条件,执行查询语句。之后,将数据模型填充到QTableView中,可滚动,可编辑(编辑后改变数据库中的存储)。
放一次完整的代码吧,但是copy下来不能运行,因为没有ui文件,自己画一个或者只看数据库部分的代码吧。
1 2 3 4 5 6 7 8 9 10 11 12 13 14 15 16 17 18 19 20 21 22 23 24 25 26 27 28 29 30 31 32 33 34 35 36 37 38 39 40 41 42 43 44 45 46 47 48 49 50 51 52 53 54 55 56 57 58 59 60 61 62 63 64 65 66 67 68 69 70 71 72 73 74 75 76 77 78 79 80 81 82 83 84 85 86 87 88 89 90 91 92 93 94 95 96 97 98 99 100 101 102 103 import sysimport timeimport PyQt5from PyQt5.QtWidgets import (QApplication, QMainWindow, QDesktopWidget, QStyleFactory, QWidget, QMessageBox, QTableView) from PyQt5.QtGui import QPalette, QColorfrom PyQt5.QtCore import Qtfrom PyQt5.QtSql import QSqlDatabase, QSqlQuery, QSqlTableModelfrom mainwidget import Ui_Formfrom mainwindow import Ui_MainWindowclass MyMainWidget (QWidget, Ui_Form): def __init__ (self, parent = None ): super (MyMainWidget, self).__init__(parent) self.setupUi(self) self.setLayout(self.gridLayout) self.db = QSqlDatabase.addDatabase("QSQLITE" ) self.db.setDatabaseName('table/test.db' ) self.db.open () if not self.db.open (): QMessageBox.critical(None , ("无法打开数据库" ), ("SQlite支持" ), QMessageBox.Cancel) return False self.model = QSqlTableModel() self.pushButton.clicked.connect(self.insert) self.pushButton_2.clicked.connect(self.query) self.pushButton_3.clicked.connect(self.insert_oneline) self.pushButton_4.clicked.connect(self.del_oneline) self.pushButton_5.clicked.connect(self.find_row) def find_row (self ): print (self.view.currentIndex().row() + 1 , self.view.currentIndex().column() + 1 ) def del_oneline (self ): self.model.removeRow(self.view.currentIndex().row()) self.model.setEditStrategy(QSqlTableModel.OnFieldChange) self.model.select() self.view.setModel(self.model) self.view.show() def insert_oneline (self ): self.model.insertRows(self.model.rowCount(), 1 ) def query (self ): self.model.setTable("people" ) self.model.setEditStrategy(QSqlTableModel.OnFieldChange) self.model.select() self.model.setHeaderData(0 , Qt.Horizontal, "ID" ) self.model.setHeaderData(1 , Qt.Horizontal, "Name" ) self.model.setHeaderData(2 , Qt.Horizontal, "Address" ) self.view.setModel(self.model) self.view.show() def insert (self ): query = QSqlQuery() for i in range (6 , 100 ): query.exec_("insert into people values({}, 'test', 'test{}')" .format (i, i)) class MyMainWindow (QMainWindow, Ui_MainWindow): def __init__ (self, parent = None ): super (MyMainWindow, self).__init__(parent) self.setupUi(self) self.q = MyMainWidget() self.setCentralWidget(self.q) self.setWindowOpacity(0.9 ) def closeEvent (self, e ): self.q.db.close() if __name__ == "__main__" : app = QApplication(sys.argv) mywin = MyMainWindow() mywin.show() sys.exit(app.exec ())
pyqtgraph使用 这个库,简直有毒,总以为我装失败了,没想到关机开机后这个库能用了。
这个绘图库是纯python图形GUI库,由于是基于pyqt开发的集成绘图模块,所以PyQtGraph绘图与底层方式实现绘图功能在速度上的区别不大。这个库的好处是,可以写两行代码,点击run example查看所有的绘图效果。
1 2 import pyqtgraph.examplespyqtgraph.examples.run()
绘图效果,看下图,个人感觉还可以,虽然比不上matlab的工具箱和matplotlib。
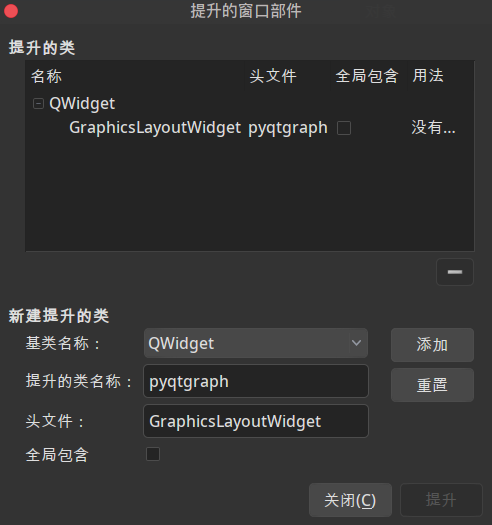
模仿上述的例子进行简单的集成。这里用到了提升窗口的技术,如果不了解,可以先看后文的提升窗口。基类:QWidget,头文件:pyqtgraph, 名称:GraphicsLayoutWidget,一个字母都不要错哦。在本代码中,使用了提升窗口的对象名为:pyqtgraph2, pyqtgraph。
1 2 3 4 5 6 7 8 9 10 11 12 13 14 15 16 17 18 19 20 21 22 23 24 25 26 27 28 29 30 31 32 33 34 35 36 37 38 39 40 41 42 43 44 45 46 47 48 49 50 51 52 53 54 import pyqtgraph as pg class MyMainWidget (QWidget, Ui_Form): def __init__ (self, parent = None ): super (MyMainWidget, self).__init__(parent) pg.setConfigOption('background' , '#f0f0f0' ) pg.setConfigOption('foreground' , 'd' ) pg.setConfigOptions(antialias = True ) self.setupUi(self) self.setLayout(self.gridLayout) self.quit_btn.clicked.connect(self.quit_act) self.pushButton.clicked.connect(self.graph_plot) self.pushButton_2.clicked.connect(self.graph_plot1) def graph_plot1 (self ): self.pyqtgraph2.clear() plt = self.pyqtgraph2.addPlot(title="test" ) x = np.random.normal(size=20 ) y1 = np.sin(x) y2 = 1.1 * np.sin(x + 1 ) bg1 = pg.BarGraphItem(x = x, height = y1, width = 2 , brush = 'r' ) bg2 = pg.BarGraphItem(x = x, height = y2, width = 2 , brush = 'b' ) plt.addItem(bg1) plt.addItem(bg2) self.pyqtgraph2.nextRow() plt2 = self.pyqtgraph2.addPlot(title="test1" ) x = np.linspace(1 , 20 , 20 ) y3 = np.random.normal(size=20 ) plt2.plot(x, y3, pen = pg.mkPen(width = 2 , color = 'd' )) plt2.showGrid(x=True , y=True ) def graph_plot (self ): self.pyqtgraph.clear() plt2 = self.pyqtgraph.addPlot(title="multi rules" ) plt2.plot(np.random.normal(size=150 ), pen = pg.mkPen(color='r' , width=2 )) plt2.plot(np.random.normal(size=150 ) + 5 , pen = pg.mkPen(color='b' , width=2 ))
Matplotlib与PyQt的结合 谈到绘图,不得不提一下Matplotlib,很出名的python绘图库。如果可以把Matplotlib绘制的图形嵌入到PyQt中,也就避免了底层绘制图像的繁琐。
说干就干。(官网也有实例)
工具库的引入:1 2 3 4 from matplotlib.backends.backend_qt5agg import FigureCanvasQTAgg as FigureCanvasfrom matplotlib.figure import Figureimport matplotlib.pyplot as pltfrom matplotlib.backends.backend_qt5 import NavigationToolbar2QT as NavigationToolbar
创建空白的绘图界面的类,实现静态绘图和动态绘图两种方法
1 2 3 4 5 6 7 8 9 10 11 12 13 14 15 16 17 18 19 20 21 22 23 24 25 26 27 28 29 30 31 32 33 34 35 class MymplCanvas (FigureCanvas ): def __init__ (self, parent=None , width=5 , height=4 , dpi=100 ): self.fig = Figure(figsize=(width, height), dpi=dpi) self.axes = self.fig.add_subplot(111 ) FigureCanvas.__init__(self, self.fig) self.setParent(parent) FigureCanvas.setSizePolicy(self, QSizePolicy.Expanding, QSizePolicy.Expanding ) FigureCanvas.updateGeometry(self) def static_plot (self ): self.axes.clear() self.fig.suptitle("static FIG" ) t = np.linspace(1 , 10 , 10 ) s = np.sin(np.pi * t) self.axes.plot(t, s) self.axes.grid(True ) self.draw() def dynamic_plot (self, *args, **kwargs ): timer = QTimer(self) timer.timeout.connect(self.update_fig) timer.start(1000 ) def update_fig (self ): self.axes.clear() self.fig.suptitle("dynamic FIG" ) l = np.random.randint(1 , 10 , 4 ) self.axes.plot([0 , 1 , 2 , 3 ], l, 'r' ) self.axes.grid(True ) self.draw()
之后,封装绘图类。将绘图类封装到MatplotlibWidget类,调用MatplotlibWidget类直接实现绘图功能。
1 2 3 4 5 6 7 8 9 10 11 12 13 14 15 16 17 18 19 class MatplotlibWidget (QWidget ): def __init__ (self, parent=None ): super (MatplotlibWidget, self).__init__(parent) self.gridLayout = QGridLayout() self.mpl = MymplCanvas(self) self.mpl_tool = NavigationToolbar(self.mpl, self) self.setLayout(self.gridLayout) self.gridLayout.addWidget(self.mpl) self.gridLayout.addWidget(self.mpl_tool) def static (self ): self.mpl.static_plot() def dynamic (self ): self.mpl.dynamic_plot()
之后在窗口QWidget里面调用MatplotlibWidget即可。
1 2 3 4 5 6 7 8 9 10 11 12 13 14 15 16 17 18 19 20 21 22 23 24 25 26 27 28 class MyMainWidget (QWidget, Ui_Form): def __init__ (self, parent = None ): super (MyMainWidget, self).__init__(parent) self.setupUi(self) self.setLayout(self.gridLayout) self.quit_btn.clicked.connect(self.quit_act) self.widget = MatplotlibWidget() self.widget.setVisible(False ) self.widget_2 = MatplotlibWidget() self.widget_2.setVisible(False ) self.gridLayout.addWidget(self.widget) self.gridLayout.addWidget(self.widget_2) self.pushButton.clicked.connect(self.dynamic) self.pushButton_2.clicked.connect(self.static) def static (self ): self.widget.setVisible(True ) self.widget.mpl.static_plot() def dynamic (self ): self.widget_2.setVisible(True ) self.widget_2.mpl.dynamic_plot()
效果如下所示:
提升窗口 已经含有的类 在上文已经提到了一次提升窗口。再说这个之前,确保已经看懂了上面pyqtgraph和matplotlib的例子,不然这里更加看不懂。之后会在说明自定义和引用已有类的角度说明如何提升窗口。(毕竟我之前也以为这个没多大用)
基类:QWidget,头文件:pyqtgraph, 名称:GraphicsLayoutWidget。
因为pyqtgraph是已经安装好的库,所以可以设置头文件为pyqtgraph,相当与传统的import。
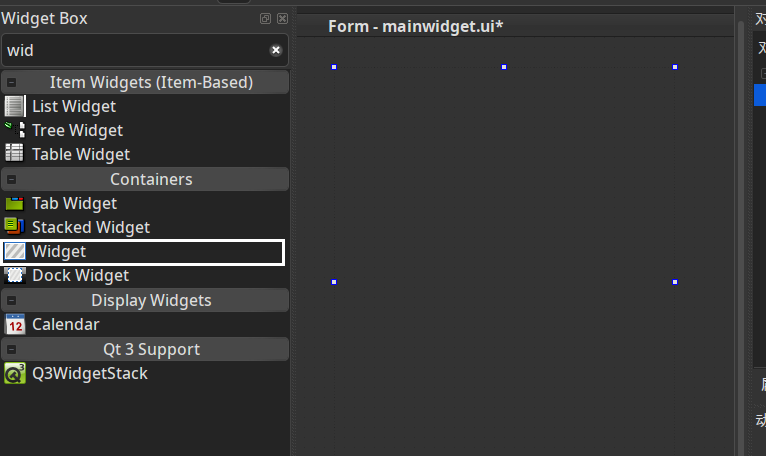
而在Qt Designer内,首先将Widget托入界面,右键,提升为。(不好意思这里没办法截图,linux下的截图可真难用,wine QQ的截图也不能全局有效)
输入:头文件:pyqtgraph, 名称:GraphicsLayoutWidget。(不要输入错误,一个字母都不要错)
输入后以此点击添加、提升即可。
之后pyuic5 -o mainwidget.py mainwidget.ui后,会在辅助的mainwidget.py文件里发现:from pyqtgraph import GraphicsLayoutWidget这么一句话,也就是,上面说的传统的import。手工也可写这行代码,为什么大费周折呢?因为提升了窗口,会发现,这个类有了自己的界面,而不在是简单的导入类,之后可以使用这个特殊的界面进行随意的拖动、布局、使用,会比纯代码方便很多。
相当与在库pyqtgraph中引入了一个布局,并且给了这个布局一个界面,这个界面可以实现绘图功能,那么以后在想绘图的时候就可以复制、拖动这个界面,更加轻松的布局和设置大小。此时提升完毕。
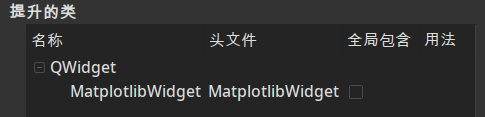
自己写的类 以上是在有相应的库和方法的前提下设置提升类。如果没有相应的库,如上文的类MatplotlibWidget,如何将自己写的类关联到Widget里面进行提升,形成容易操作的控件呢?且看下文。
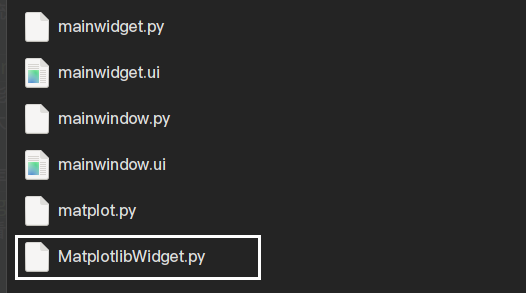
这个时候需要将自己写的类单独拿出来成为一个文件,在同级目录下引用即可。
文件结构:
提升方法 自行托入Widget,右键提升,输入名称和头文件,名称是类名,文件就是同级目录下的文件,最后添加,提升即可。
相关代码: MatplotlibWidget.py
1 2 3 4 5 6 7 8 9 10 11 12 13 14 15 16 17 18 19 20 21 22 23 24 25 26 27 28 29 30 31 32 33 34 35 36 37 38 39 40 41 42 43 44 45 46 47 48 49 50 51 52 53 54 55 56 57 58 59 60 61 62 63 64 65 66 67 68 69 70 71 import sysimport numpy as npimport PyQt5from PyQt5.QtWidgets import (QApplication, QMainWindow, QDesktopWidget, QStyleFactory, QWidget, QSizePolicy, QPushButton, QGridLayout) from PyQt5.QtGui import QPalette, QColorfrom PyQt5.QtCore import Qt, QTimerfrom mainwidget import Ui_Formfrom mainwindow import Ui_MainWindowfrom matplotlib.backends.backend_qt5agg import FigureCanvasQTAgg as FigureCanvasfrom matplotlib.figure import Figureimport matplotlib.pyplot as pltfrom matplotlib.backends.backend_qt5 import NavigationToolbar2QT as NavigationToolbarclass MymplCanvas (FigureCanvas ): def __init__ (self, parent=None , width=5 , height=4 , dpi=100 ): self.fig = Figure(figsize=(width, height), dpi=dpi) self.axes = self.fig.add_subplot(111 ) FigureCanvas.__init__(self, self.fig) self.setParent(parent) FigureCanvas.setSizePolicy(self, QSizePolicy.Expanding, QSizePolicy.Expanding ) FigureCanvas.updateGeometry(self) def static_plot (self ): self.axes.clear() self.fig.suptitle("static FIG" ) t = np.linspace(1 , 10 , 10 ) s = np.sin(np.pi * t) self.axes.plot(t, s) self.axes.grid(True ) self.draw() def dynamic_plot (self, *args, **kwargs ): timer = QTimer(self) timer.timeout.connect(self.update_fig) timer.start(1000 ) def update_fig (self ): self.axes.clear() self.fig.suptitle("dynamic FIG" ) l = np.random.randint(1 , 10 , 4 ) self.axes.plot([0 , 1 , 2 , 3 ], l, 'r' ) self.axes.grid(True ) self.draw() class MatplotlibWidget (QWidget ): def __init__ (self, parent=None ): super (MatplotlibWidget, self).__init__(parent) self.gridLayout = QGridLayout() self.mpl = MymplCanvas(self) self.mpl_tool = NavigationToolbar(self.mpl, self) self.setLayout(self.gridLayout) self.gridLayout.addWidget(self.mpl) self.gridLayout.addWidget(self.mpl_tool) def static (self ): self.mpl.static_plot() def dynamic (self ): self.mpl.dynamic_plot()
引用 最终呈现的效果和上面matplotlib绘图一样。这里只给出对比部分的代码。
1 2 3 4 5 6 7 8 9 10 11 12 13 14 15 16 17 18 19 class MyMainWidget (QWidget, Ui_Form): def __init__ (self, parent = None ): super (MyMainWidget, self).__init__(parent) self.setupUi(self) self.setLayout(self.gridLayout) self.gridLayout.addWidget(self.widget) self.gridLayout.addWidget(self.widget_2) self.pushButton.clicked.connect(self.dynamic) self.pushButton_2.clicked.connect(self.static)
Html的动态绘图 直接引入画好的图片即可,不过图片的后缀是html,使用QWebEngineView加载即可,一个坑是:必须使用绝对路径,相对路径是找不到的。另一个坑是,Qt4 Designer里面没有QWebEngineView这个类,因为这个类是新的,Qt4 Designer 里面只有旧的类QWebView。别问我为什么不用新的,因为linux下还没有Qt5 designer。
旧的类不再维护,新的类使用chromium内核,如果不想写代码实现(布局,定位,大小,这里写代码很麻烦的),那么怎么在Qt4 Designer使用新的类呢?
提升窗口为QWebEngineView, 同样不要写错一个字母。
Html的绘图技术的强大之处在于炫酷、可交互。而python也不缺少html的绘图库,如plotly(javascript的绘图库,python调用接口),还有pyecharts,也很炫酷。(pyecharts版本做了更新,之前就版本的代码无法运行,我一年前的时候还用的旧版本,新版本的用法参考github)
echarts的(我写的时候服务器维修,无法下载图片,使用的pyecharts的):https://gallery.echartsjs.com/explore.html#sort=rank~timeframe=all~author=all
pyecharts的:https://github.com/pyecharts/pyecharts/tree/master/example
我随意挑选了一个,执行后生成本地的html文件(可交互的图形)。
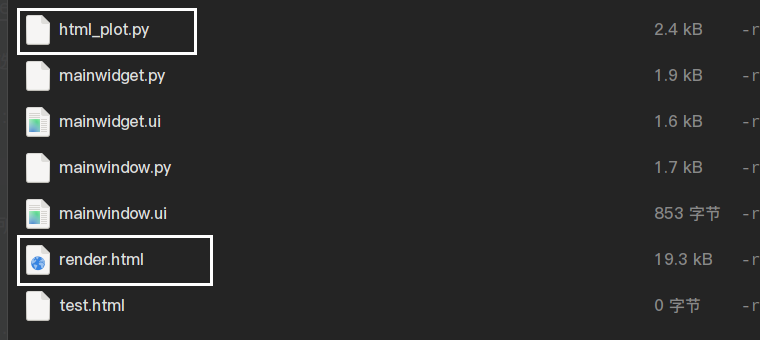
文件结构:
效果如下所示:
代码如下:1 2 3 4 5 6 7 8 9 10 11 12 13 14 15 16 17 class MyMainWidget (QWidget, Ui_Form): def __init__ (self, parent = None ): super (MyMainWidget, self).__init__(parent) self.setupUi(self) self.setLayout(self.gridLayout) self.quit_btn_2.clicked.connect(self.html_plot) def html_plot (self ): url = "/home/lanling/Srcode/python/tools/GUI/practice/Pyecharts/render.html" self.web_view.load(QUrl.fromLocalFile(url))
结束语 因为这里给的都是核心代码,没有给全部代码,如果你是在弄不出来,底下留言给下邮箱,我给你代码。
不过还是建议多折腾,多走两步,多研究,伸手党不好。
下一步,自定义信号与槽,类与函数进阶,多线程。